Setting up Site Speed Reporting
Thinking about site speed and performance for your Shopify store should get you excited. While the idea of investing time and money may make you cringe, the impact on eCommerce sites directly correlates to conversion and bottom line. Now we’re back to exciting!
If you’re still unsure wether or not to invest into site performance improvement, here are some insightful stats from industry leading CDN service provider Akamai:
- A 100-millisecond delay in website load time can hurt conversion rates by 7 percent
- A two-second delay in web page load time increase bounce rates by 103 percent
- 53 percent of mobile site visitors will leave a page that takes longer than three seconds to load
Source:
Akamai Online Retail Performance Report: Milliseconds Are Critical Akamai April 19, 2017
How to measure Progress, the Apples to Apples Way
Before you jump into making major development changes, you should first set up a proper way to measure progress. There are hundreds of ways to measure site speed…
…as well as hundreds of ways to interpret the results. There’s calculated site speed, which testing tools use to grade your site, and interpreted site speed, which your customer perceives as to how fast and responsive your site is. While the former might help SEO and please the higher-ups, the latter impacts bounce rate and conversion. Make sure to establish your goals accordingly.
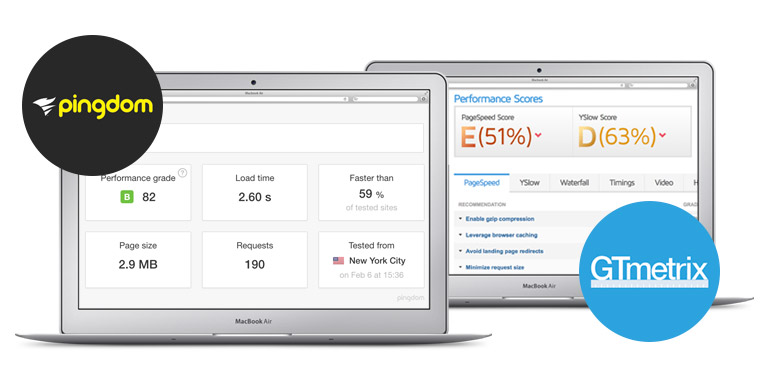
Find a measurement tool with consistent results. We currently use the Pingdom Subscriber Account (pingdom.com) as they average out a full week’s site speed analysis to create more consistent results.
When you’re measuring your progress, make sure you are testing the same factors like page load, size, number of server requests, against the same types of pages including the homepage, product listing page, product page, using the same measurement technique. In our case, we’re using Pingdom weekly averaged reports. This will help normalize your data significantly. If you’re curious, try sending your site through several different online site speed tools to note the difference in results.
Creating a Site Speed Budget
What exactly is a site speed budget? In simple terms, it’s the measurable performance limits and goals you set for your site in the long term. Measurable limits include page load time, the number of server requests, and the total page size. Just like the stock market, your site speed will jump up and down in the short-term, but the long-term trend line should be sending you in the right direction. This is where a Site Speed Budget is important. It will help you make sense of your results in the long run, and helps you catch pitfalls along the way. There are plenty of resources online that show you how to write such a report, such as the one below.
Key CDN – How to make a Performance Budget
With eCommerce sites, it’s useful to compare several sections of your site like the Homepage, Product Listing Page, Product Page, and Checkout. When creating the report, it is useful to add columns for critical (a low performing speed that should not be passed), budget (a realistic site speed goal to attain), and stretch goal (a lofty goal to aim for).
Sticking to your Budget
Let’s say you created your budget, but due to some new features deployed to your site, performance takes a dip. Here are three options that will help you get back on track. Try to be strict with these, they’re not always easy to enforce.Don’t Break the Bank on your Budget. Optimize, Delete, or Hold
- Optimize: Optimize an existing feature or asset on the page
- Delete: Remove an existing feature or asset from the page
- Hold: Don’t add the new feature or asset
Make Reporting and Recommendations part of your Routine
Since you now have reporting on lock, and a solid site speed budget to reference, you can leverage this new setup to perform regular reviews. In our case, we add a task every two weeks to review current standings, compare them to the last report, and make recommendations for improvements.
Reports will be easy to pull, and will set you up for the following abilities:
- Identify current averaged site speed
- Pinpoint any downswing in performance
- Review recent deployments that might have had an effect on performance
- Make new recommendations for improvements
- Evaluate costly features that could be sacrificed
- Celebrate wins!
Now that you have a budget, a proper way to track, and a plan to report on your findings, it’s time to start making improvements. As the second part of this series, I will be highlighting specific actions you can take to help improve site speed and performance for your Shopify store. Stay tuned!


Comment (1)
Lakeisha Lucien
Hello there! I simply want to give you a big thumbs up for your excellent information you have here on this post. I will be returning to your website for more soon.